I have been digging into 50 years of return data across four big U.S. asset classes: stocks, residential real estate, 10‑year Treasuries, and gold. I did not go into this as a market wizard. I went in as a learner who wanted to understand what actually builds wealth and what only feels productive. The numbers told a simple story. Compounding rewards patience. Hustle helps only when it protects compounding or feeds it. Everything else mostly gets in the way.
Wealth is built in silence. Compounding works best when you give it time and space.
What compounding really does
Compounding is the quiet math of earning returns on your past returns. It sounds boring until you run the numbers. A $10,000 investment that compounds at roughly the historical stock market average turned into about $17,830 after 5 years. Stretch the horizon to 10 years and it becomes about $31,800. At 20 years it jumps to roughly $101,110. At 30 years it reaches about $321,530. The same $10,000 in bonds reached about $13,410 in 5 years and about $58,210 in 30 years. Real estate landed near $46,760 over 30 years. Gold ended around $48,710. Same starting dollar. Same economy. Very different outcomes once time goes to work.
The most important insight here is not that stocks often win. It is that time creates the separation. After 5 years, the difference between assets is noticeable but not dramatic. After 30 years, the gap is a canyon. Compounding is slow, then sudden. You do not feel much for a while, then the curve steepens and does the heavy lifting for you.
What half a century of markets actually looked like
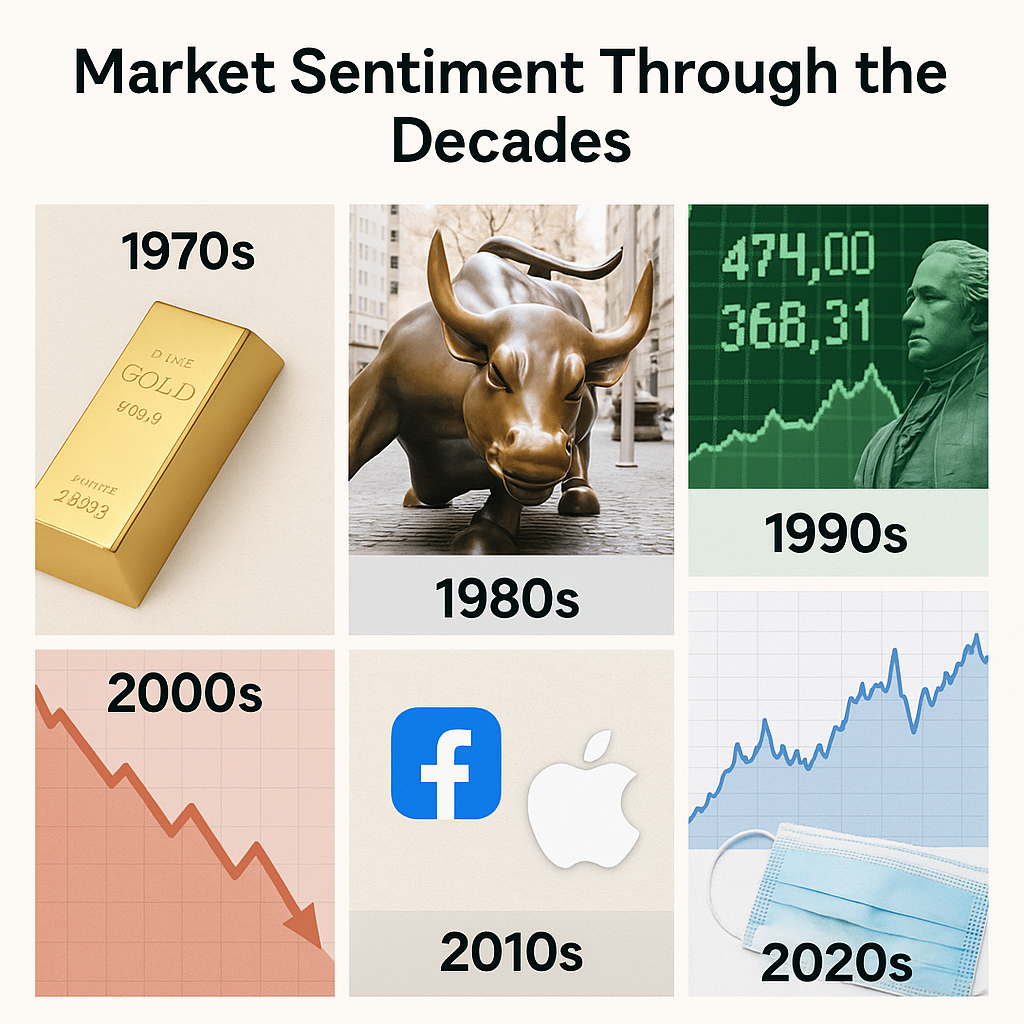
The research organizes returns by decade and adjusts for inflation as well. It tells a very human story. Each period had a dominant theme. That theme shifted. Long horizons smoothed the noise.
- 1970s. Inflation averaged about 7 percent per year. In nominal terms stocks grew about 5.9 percent annually, but once you adjust for inflation the real return was roughly negative 1.3 percent. Housing barely stayed ahead at about 1.3 percent real. Bonds also struggled after inflation. Gold was the standout with about 19.8 percent real.
- 1980s. Disinflation arrived. Equities posted about 17.3 percent a year nominal and 11.7 percent real. Bonds earned about 12 percent nominal and 6.5 percent real as yields fell. Housing was modest at about 0.7 percent real. Gold lost ground in real terms.
- 1990s. Another golden run for stocks. About 18 percent nominal and 14.7 percent real across the decade, helped by the tech boom. Bonds returned about 7.4 percent nominal and 4.3 percent real. Housing was flat to slightly negative after inflation. Gold kept sliding.
- 2000s. A hard decade for equity investors because of the dot‑com bust and the global financial crisis. Stocks delivered a slight negative annual return even before inflation. Bonds and gold did well. Housing saw a boom then a bust but still managed a small real gain across the full decade.
- 2010s. A long expansion. Equities compounded around 13.4 percent nominal and 11.5 percent real. Bonds were modest. Housing recovered and moved higher. Gold roughly kept pace with inflation.
- 2020s so far. Volatile but strong for stocks. About 14.4 percent annualized since 2020 in nominal terms and roughly 9.8 percent real. Bonds had a rough stretch as inflation spiked and yields jumped. Housing saw a pandemic surge then leveled, still posting a solid gain. Gold advanced as a hedge during uncertainty.
Put the whole period together and you get the long‑view averages. From 1975 to 2024, U.S. equities delivered roughly 11 to 12 percent per year in nominal terms, or about 7 to 8 percent after inflation. Bonds averaged roughly 6 percent nominal and about 2 percent real. Housing and gold sat around 5 to 6 percent nominal and about 1.5 to 2 percent real. The pattern is clear. Stocks offered the highest long‑run growth but with the roughest ride in the short run. Bonds and housing were steadier but slower. Gold was cyclical with modest real appreciation over the full span.
The horizon effect: five years versus thirty
The data makes the horizon effect hard to ignore. It shows how $10,000 grows if you simply hold at the long‑run average for each asset. At 5 years, the ranking is predictable but the spread is small. At 30 years, the spread explains why one person ends up with life‑changing capital while another ends up with only a helpful cushion. The big message is not to pick the winner every year. It is to pick a sensible mix, tilt toward growth if your horizon allows, and then stay invested long enough to let compounding separate signal from noise.
Short horizons are emotional. The same data shows that stock returns in a single year ranged from roughly plus 32 percent to minus 37 percent since 1975. Over five‑year spans the worst case was only a slight annual loss and the best was in the high twenties per year. Stretch to twenty years and the picture changes. U.S. stocks have not lost money in real terms over modern twenty‑year windows. Even the worst twenty‑year result since 1970 still came in near 5 percent per year. That is a big psychological shift. Time converts scary volatility into a rising trend that favors the patient owner.
Time in the market beats timing the market
I used to think the right move was to wait for the perfect entry, then ride the wave. The literature says otherwise. Many of the best market days cluster near the worst days. If you are out of the market during a handful of big rebounds you can cut your long‑term results in half. Studies show that missing the top days is devastating, while simply being present through the mess tends to win. It is not about perfection. It is about presence.
Schwab ran a thought experiment over many twenty‑year periods. The investor who deployed cash immediately often finished just behind the mythical perfect timer who always bought at the bottom. Both crushed the person who kept waiting in cash. Over 30, 40, and 50 years the ranking did not change. The consistent investor who stopped trying to pick the low was almost always in second place and sometimes tied with first. The only consistent loser was procrastination.
There is also hard evidence on frequent trading. Barber and Odean analyzed 66,000 retail accounts in the 1990s. The people who traded the most earned about 11.4 percent per year while the market returned 17.9 percent. Even average traders lagged the index after costs. Their conclusion was blunt. Trading was hazardous to wealth. High turnover meant fees, taxes, and bad timing that ate results. Meanwhile, the index investor who bought and held quietly outperformed most of the activity.
When I put these pieces together, the lesson is practical. The market pays for time, discipline, and low friction. It punishes flinching. It also punishes the itch to tinker.
What this means for someone who wants real results
I do not want to posture as if I have all the answers. Here is how I am organizing what I learned and how I am putting it to work.
1) Think in decades. Five years is not a long period in investing terms. The data shows why. Short windows are noisy. Twenty to thirty years turn the math of compounding into the main driver of outcome. If your goal is wealth creation and your timeline allows for it, set your strategy with decades in mind.
2) Tilt toward growth, then diversify around it. The long‑run record favors equities for growth. Bonds add ballast. Real estate helps with inflation and stability. Gold is a hedge for shocks. You do not need to guess which one will win next year. You need a mix that gives you the best odds across many years while keeping you invested during rough patches. The 1970s and 2000s remind us that leadership rotates. Diversification keeps you in the game until the next cycle.
3) Automate contributions and rebalancing. Every contribution is new fuel for compounding. Automation keeps you from negotiating with yourself when headlines get loud. Rebalance on a fixed schedule or at clear thresholds. Rebalancing sells some of what has run hot and adds to what got cheaper. This is a behavior system that lets compounding continue while risk stays in line.
4) Cut frictions to the bone. The Barber and Odean study reads like a caution label. Activity has a cost. So do taxes and fees. A simple, low‑cost portfolio that you hold for many years lets more of the gross return become your net return. That is a quiet but powerful edge.
5) Decide your rules before you need them. If you know how you will respond to a 30 percent drawdown before it happens, you are less likely to abandon your plan when it arrives. The historical record shows large drawdowns are part of owning equities. The reward for living through them is the long‑run return that makes compounding so potent.
6) Use cash for sleep and emergencies, not as a market‑timing bet. The Schwab analysis compared different timing approaches over many windows and found that the cost of waiting was often larger than the benefit of perfect timing. Build the cash buffer you need for life. Then let your long‑term capital stay invested.
A closer look at “bad timing” and why patience still wins

If you bought at the worst possible moment, could compounding still bail you out? The data says yes if you give it enough time. Even the investor who bought at the 2000 peak and held through 2020 still earned about 5 percent per year in real terms. That is not a victory lap, but it is a strong counter to the fear that one bad entry ruins everything. What ruins everything is interrupting the compounding repeatedly.
The same lesson appears in the distribution of annual results. One‑year returns are all over the map. Five‑year annualized returns have a wide range. Twenty‑year results narrow and turn solidly positive in real terms. The longer you can hold, the more your outcome converges toward the asset’s typical long‑run return. Buying quality assets and then staying put stacks the odds in your favor.
Why hustle often feels productive but is not
Hustle is attractive because it gives us something to do. It feels like control. The problem is that most hustle introduces frictions that compound in the wrong direction. Every in‑and‑out trade breaks the compounding chain. Every attempt to sidestep a scary headline risks missing the sharp recoveries that make up a large share of long‑run gains. The cost is invisible at the time. It becomes obvious years later when the balance is smaller than it could have been.
There is a better way to use hustle. Channel it into the parts of your plan that raise the odds of success without touching the compounding engine. Increase your savings rate. Raise your skills and income. Optimize taxes within the law. Improve your decision process. All of that fuels the machine instead of clogging it.
What you can do next, based on the research
Here is the action plan I recommend to anyone who wants a clear starting point. It is simple on purpose.
- Pick an allocation that you can hold through a full cycle. For many long‑horizon investors that means a heavy equity weight, a clear role for bonds, and small sleeves for real estate and gold if you want those specific hedges. The decade tables remind us that each asset has its moment. A mix keeps you invested when leadership changes.
- Automate monthly contributions. Treat it like a bill. The contribution itself is a compounding engine. The timing will average out over the years. The Schwab data on immediate investing defeating waiting supports this.
- Rebalance once or twice a year. The goal is risk control, not return enhancement. The side effect is a buy‑low, sell‑high habit that does not rely on forecasts.
- Keep fees and taxes low. Prefer broad, low‑cost funds. Hold long term to earn the lower capital gains rates and reduce turnover costs. The psychological and tax advantages of long‑term holding are worth re‑reading.
- Write down a drawdown plan. Decide today how you will behave when your portfolio is down 20 percent. Write the rule. Share it with someone who will hold you to it. Volatility is the price of admission for the long‑run premium. The long‑run premium is the reason compounding turns small seeds into forests.
- Measure what you can control. You cannot control next quarter’s return. You can control savings rate, asset mix, fees, and behavior. Track those. Improvement there multiplies over time.
A short story to keep in your pocket
Imagine two savers who each set aside $10,000 and then add the same amount every year. The first person spends time perfecting entries and exits. They miss several big up days, incur extra taxes, and pay higher fees. The second person picks a sensible mix and keeps adding. After decades the difference will not just be a few percent. It will be a different life. The data does not follow those two specific people, but its lessons line up with that story. Frequent trading cut results by 5 to 6 percentage points a year for the most active investors. Missing the best days slashed long‑term returns in the timing research. Staying invested and letting compounding work produced the most reliable outcomes across rolling twenty‑year windows.
Bringing it all together
Here is the simplest way I can say it after reading through the tables, the decade notes, the compounding math, and the case studies. The market rewards the investor who shows up early, stays put, and keeps costs low. It does not reward anxious activity. Over the last 50 years, equities have offered the strongest fuel for compounding. Bonds and real estate have played supportive roles. Gold has been a crisis hedge with modest long‑run real growth. The winner in any given year moved around. The winner over thirty years was patience.
I am still learning. I am practicing patience in real time. I am building systems that make the patient choice the default choice. The data makes me confident that this is the right direction. Not always easy. Always simple. Let compounding do its work and give it the one resource it needs most. Time.